 (This post is part of my attempt to get all of my resources online for y’all. See more files and FAQs here.) Are you ready to get this Precal train rolling???
I used to start Precal with the “Chapter P” in my book: basically, hey, remember this from Algebra II? No, ok, let’s teach it again. Because there’s no better way to start off a course than with absolute value inequalities, amirite?
Right….so I changed it up this year because (1) I had only PreAP Precal and I do expect them to be a little more prepared that regular and (2) the first full week of school we had a week of grade level meetings and picture days, which meant I saw some periods all five days and some three and some kids in and out throughout. So we did a review of equations instead. I just gave them the sheet and said “have at it! See what you remember and what your group can figure out, then we’ll follow up on the rest!”
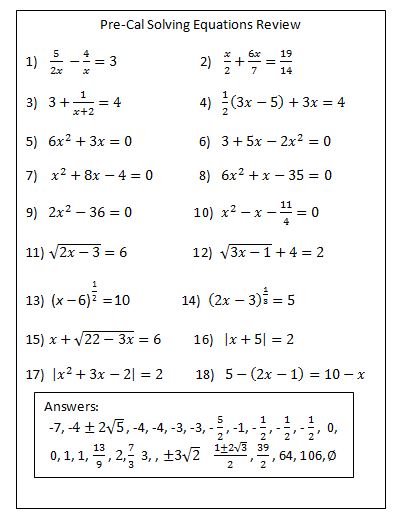
A former coteacher made this, which is why it’s written with the new equation editor (HATE) and also why it says “Pre-Cal” instead of “Precal”.
File here (4 to a page!). I think I remember it taking about 3-4 days for them to finish.
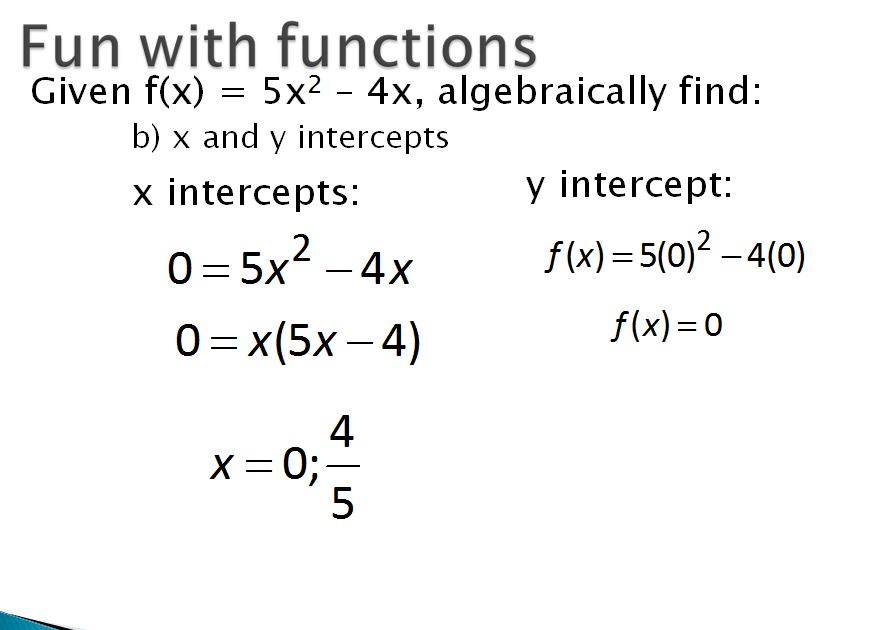
Then we started with the “Chapter 1” business: lots of definitions and descriptions and probably stuff they should know from Algebra II but don’t, e.g. functions.
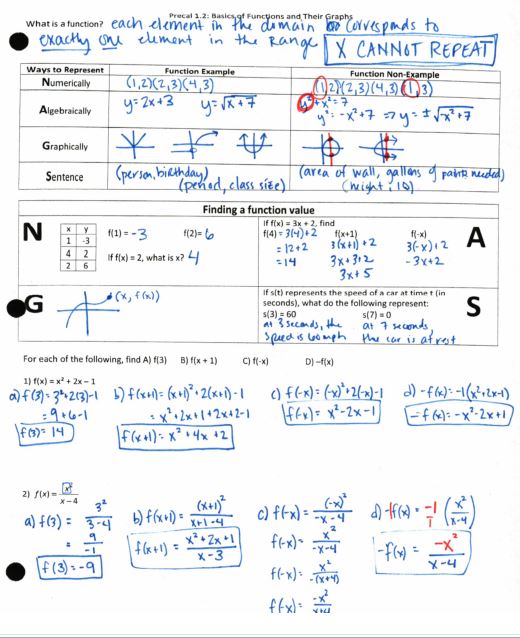 File here. I really need to start using NAGS (Numerically, Algebraically, Graphically, Sentence) more throughout the year.
The homework for the chapter:
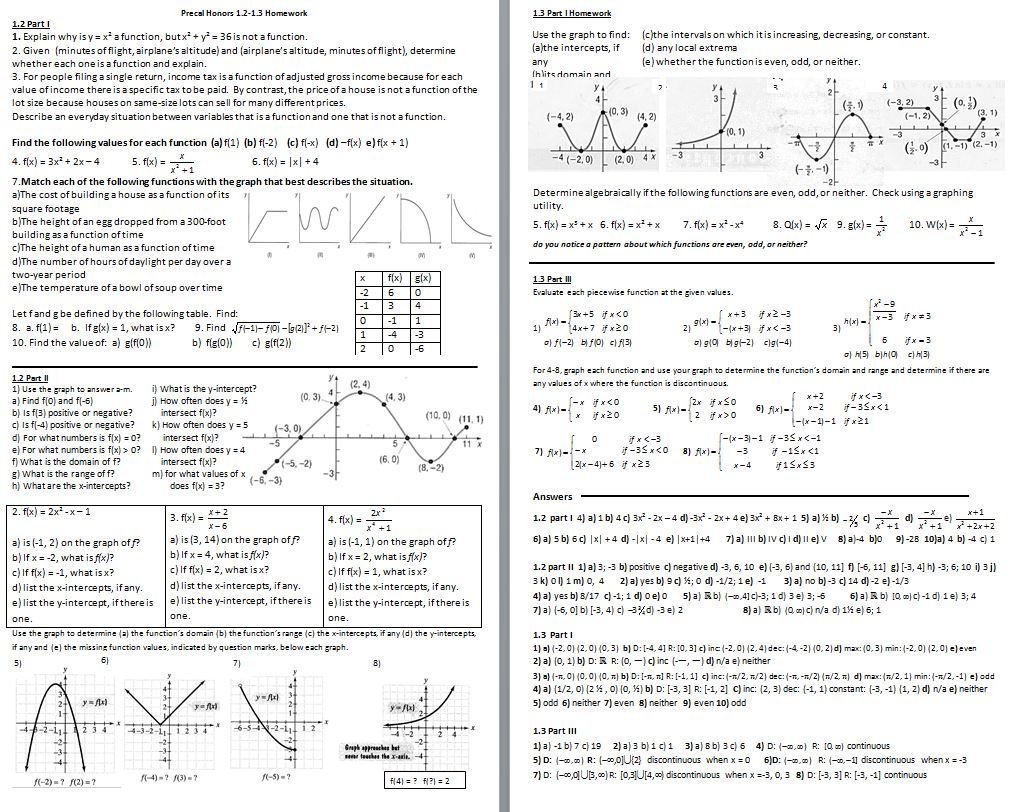 File here. (I print it 2 to a page)
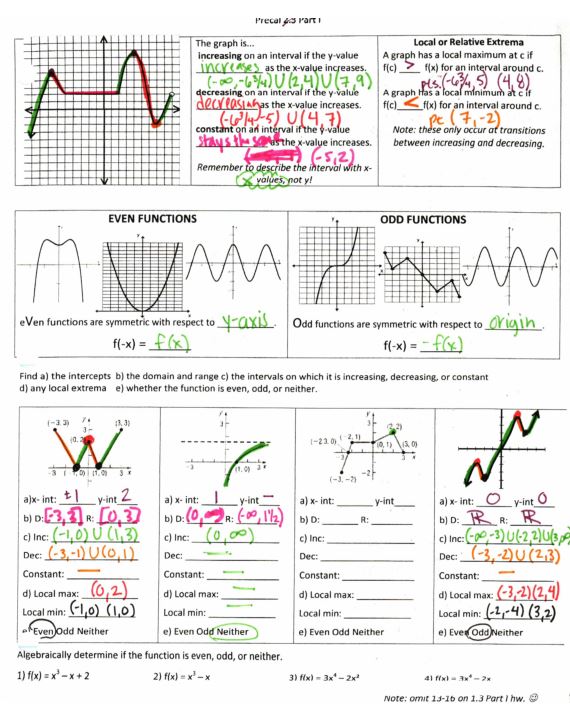
Then everything you could possible want to know from a graph:
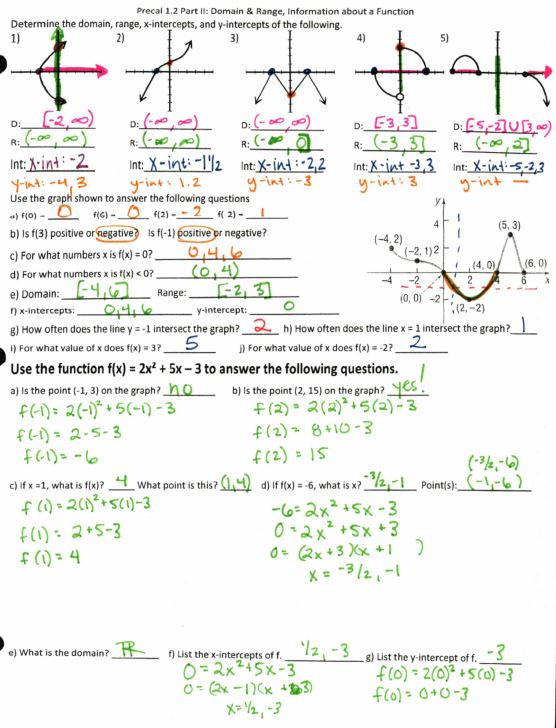
Oh, wait, actually that wasn’t everything you could want to know about a graph! How about relative extrema and even/oddness?
 File here. I use a powerpoint to introduce even and odd graphs:
 File here. The animation on this is actually pretty neat. Once you download it, be sure to watch the actual slideshow (not just scroll through the slides) so you can see it.
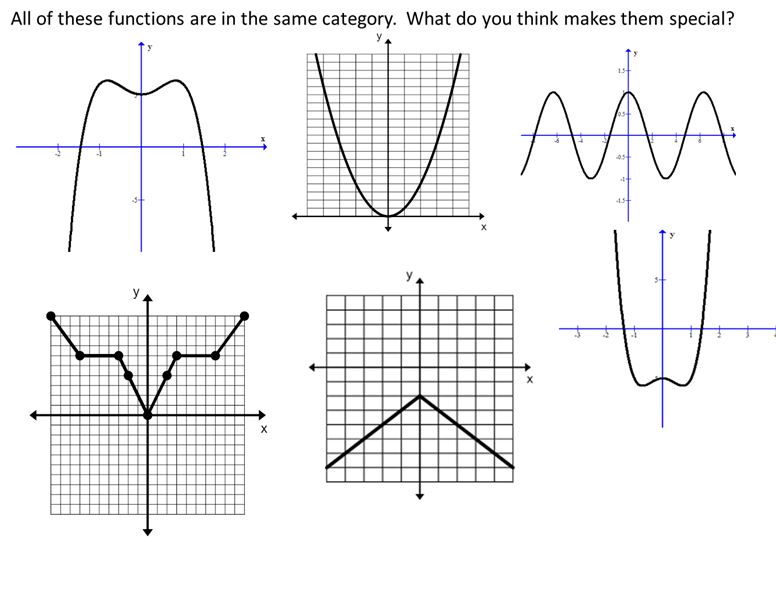
Then we spend some time playing “Math Pictionary,” where we break out the whiteboards and make graphs that meet different conditions:
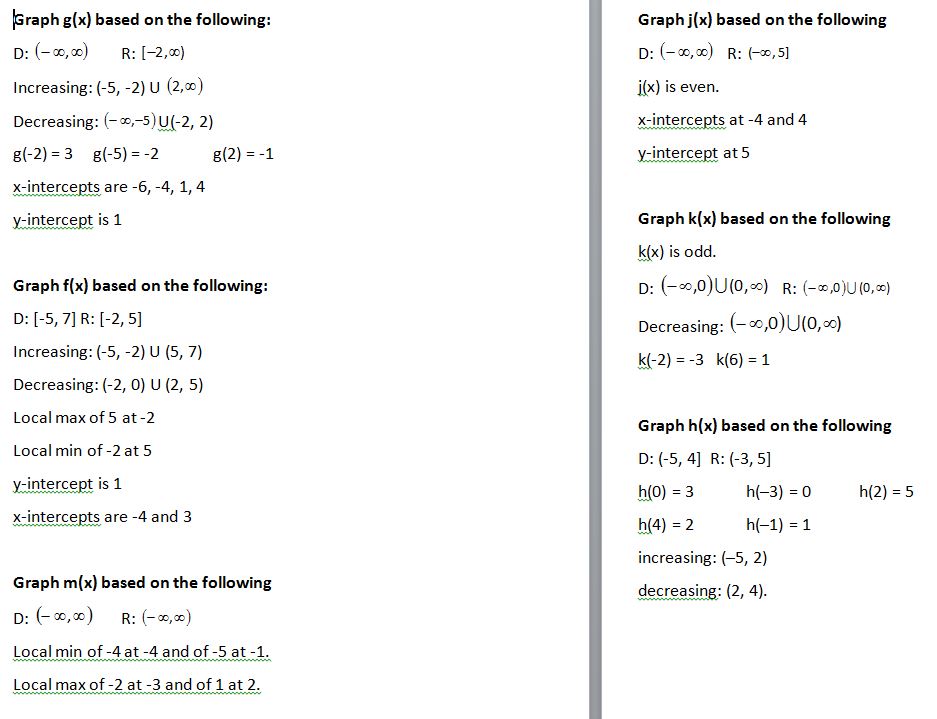 File here. If time allows, I also show a funky graph and have groups come up with as many descriptors as possible. Then we go around and each group shares one, no repeats. The last group to have one to share wins!
By this time, everyone should have had a chance to get a graphing calculator, so we start using it:
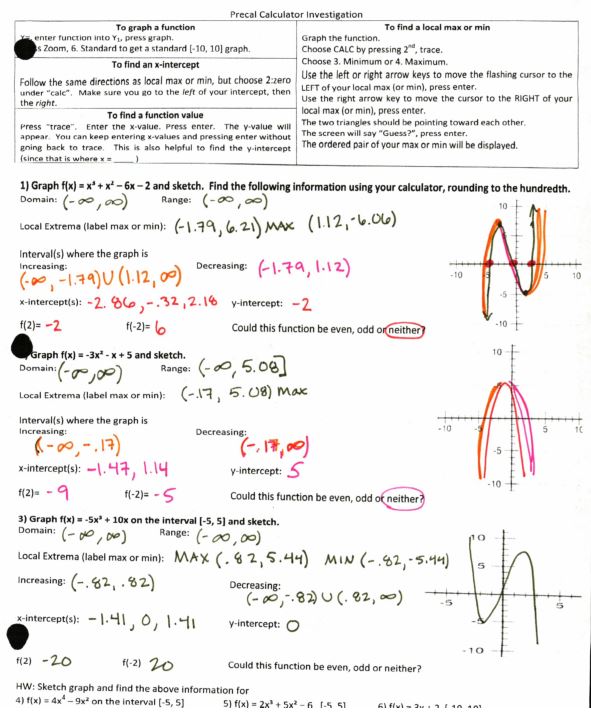 File here. Next time I may put some graphs on there that require changing the window to see everything.
I know I said I wasn’t going to reteach Algebra II (or, ahem, Algebra I) topics, but being able to write the equation of a line is just too important a topic not to spend a day on. Also, using this new way of graphing-by-translating and writing point-slope form is a nice (re)intro to (h, k).
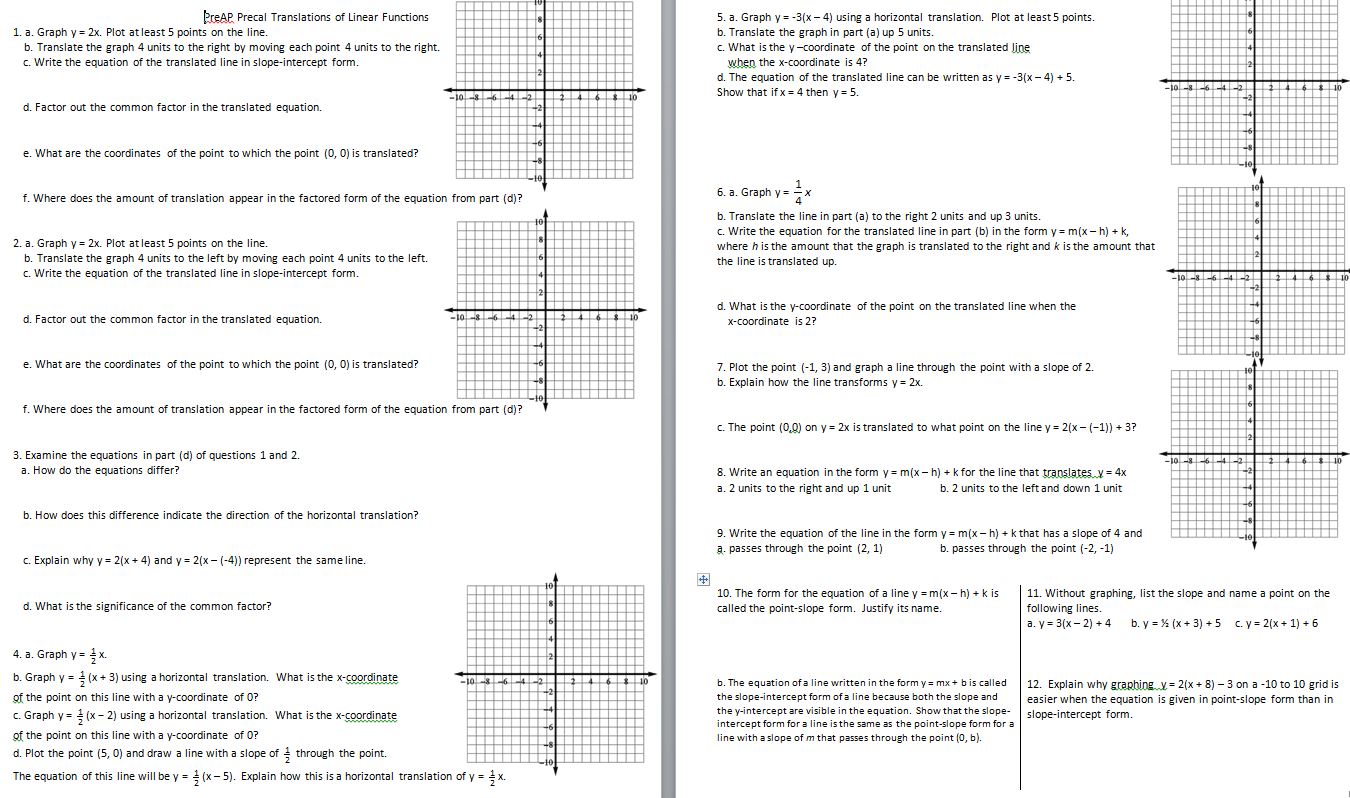
Now I’m going to stop here because I think you may have just breezed by this without trying it, thinking “oh, just another graphing/writing equations worksheet” but it’s not! I promise! Try this first problem:
1) Graph y = 2x. (it’s ok if you do it in your mind, but feel free to get paper. I’ll wait.)
2) Translate to the right 4 units by moving each point 4 to the right.
3) What is your new y-intercept? Write your equation in slope-intercept form.
4) Now factor out the GCF.
WHAT?!?!?!?!?!?!?!? Yeah, that just happened. The mystery of why h is negative in y = a(x – h) + k is solved with a simple four-step line problem. (Ok, maybe not “solved” because that will come a little bit later, but for now it’s pretty cool, eh?)
Ok, enough amazement, back to work with piecewise functions (we haven’t started doing them in Algebra II yet, so this is the first time they’ve seen them):
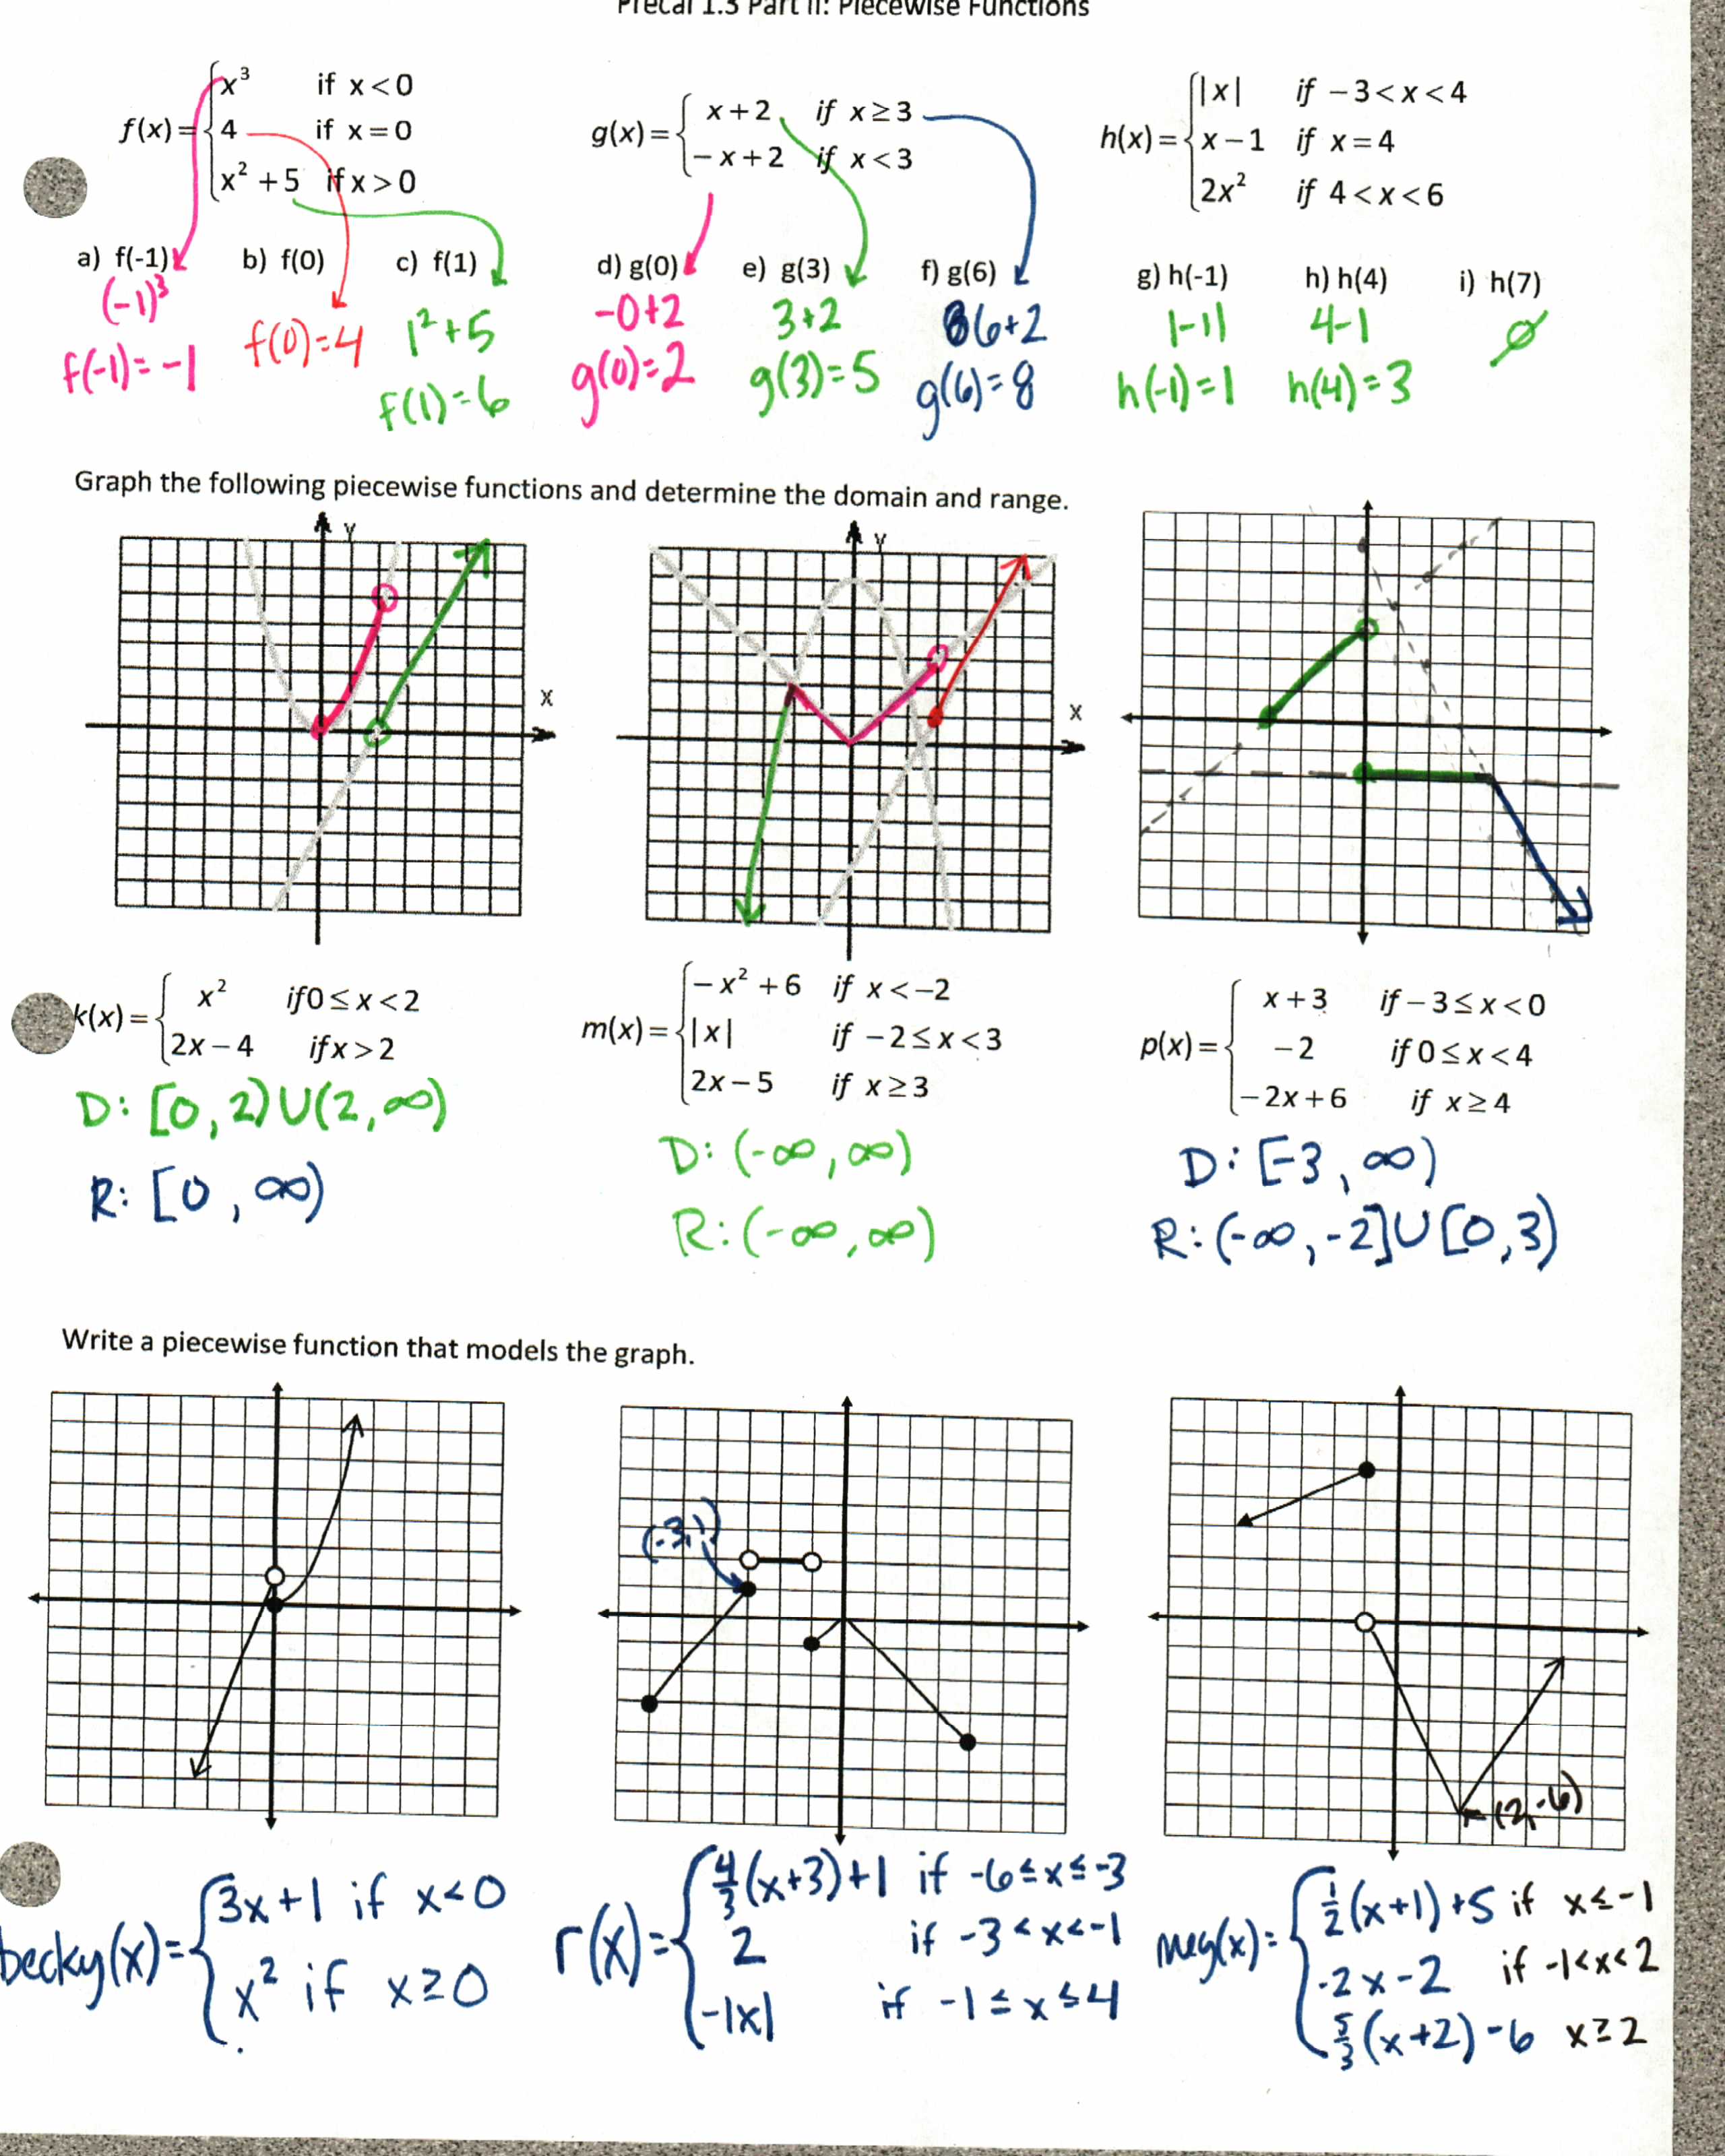 File here. Regular Precal file (more graph practice, no writing equations) here.
Yeah, check out those first graphs…the gray graphs are already on there for them so we can focus on the restricting the domain of each one before we pull it all together and graph from scratch (which I do by graphing all the functions with dotted lines, then filling in the parts that I need, so it’s very similar to the first examples).
Then it’s time for Average Rate of Change, which didn’t go so well this year (I was also out for a meeting on the second day so that didn’t help). And it started so well when I let them loose on this:

I print 2 to a page so this was all on the front. And they were rocking and rolling. Then we flipped to the back:
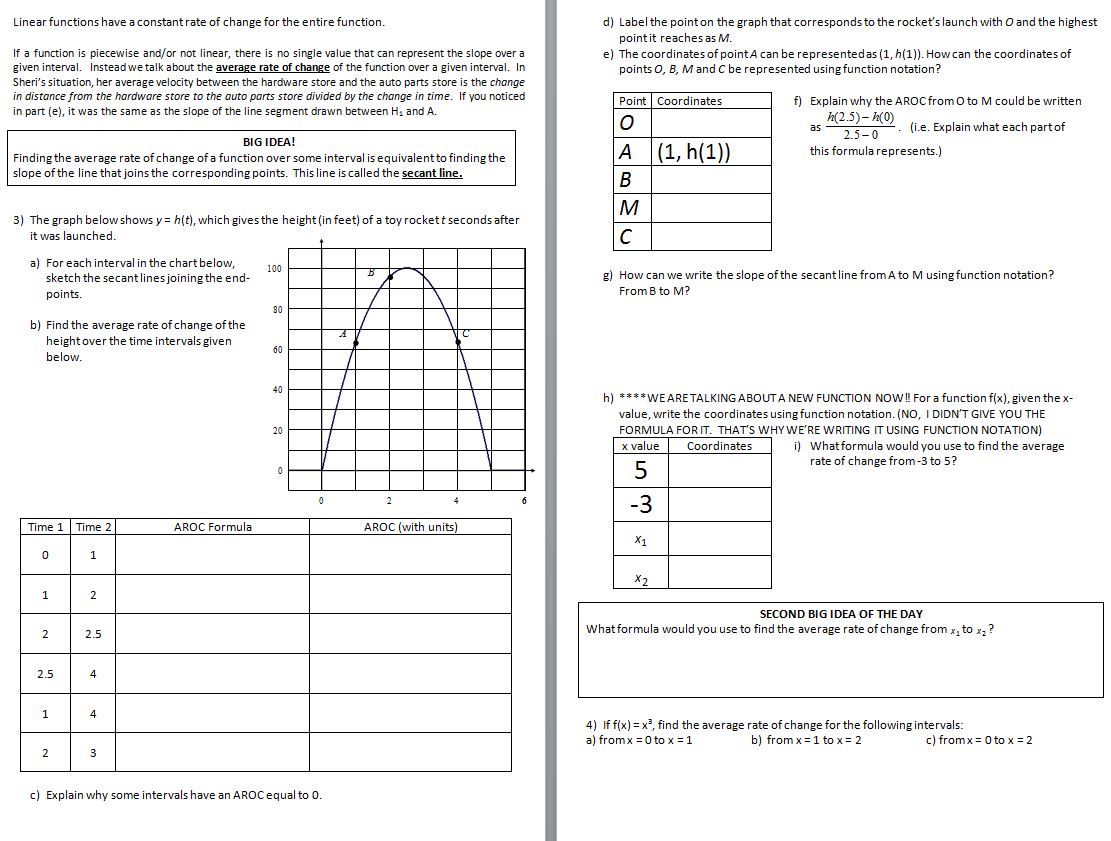
(file here) I HAVE NO IDEA HOW TO DO ANY OF THIS BECAUSE IT’S USING DIFFERENT WORDS THAN THE FRONT!!!!! WHAT IS THIS MADNESS?????? And now you want us to do these practice problems?
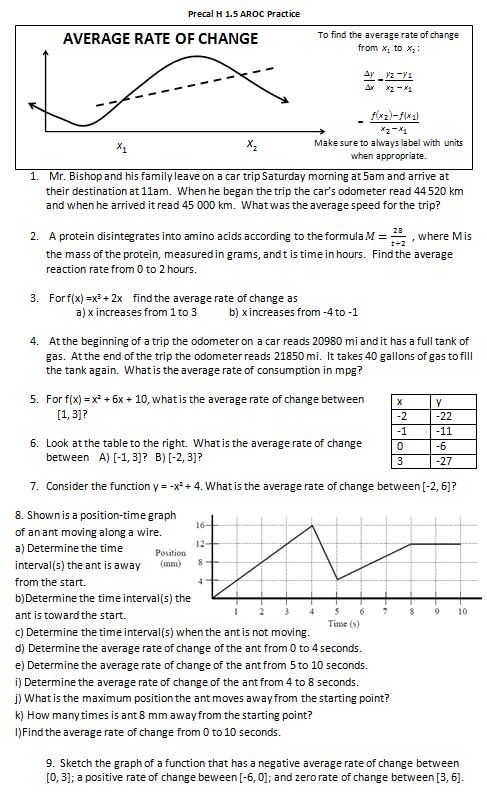
(file here) We spent 3 days on this (again one of them I was out), and I can’t help but thinking if we started with this like I usually do:
 (file here) and then spent two days applying it, they’d have a better feel for what AROC is than they did. Or maybe some hybrid of the front of the first worksheet, this, then the back?
As a side note, using The Biggest Loser as an example of AROC is great. It always hurt my head if the graph went up and down, but the AROC was zero. “It can’t be ‘no change’! We were totally changing the whole time!!” But if you think of it as a contestant gaining weight and then losing the same amount of weight in a week, at the weigh-in she’ll have 0 change. (This is also a good time to do a PSA to your students about not being obsessed with your weight every day.)
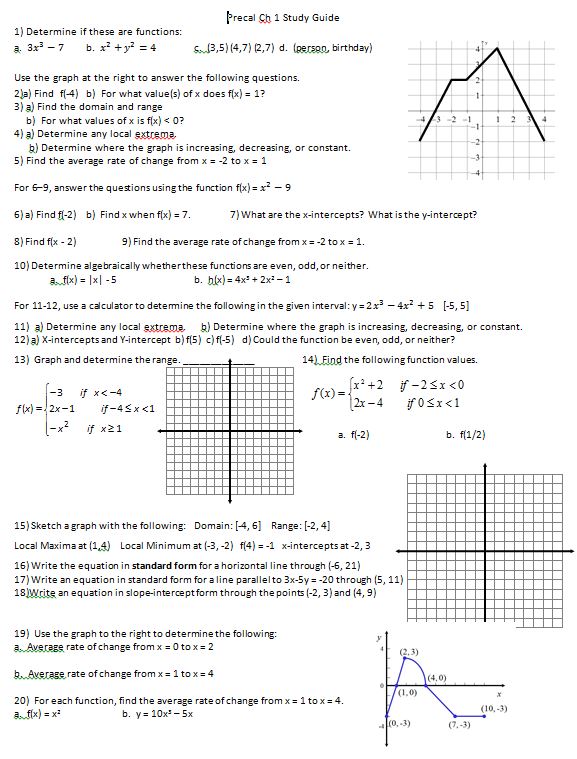
Finally (finally!) it’s review:
and the study guide:
Whew! I think I’m going to get off the train at Function Junction and take a break, but stay tuned for the next installment of “Wow, Meg Wasn’t Lying When She Said She Killed a Lot of Trees.”

 No, it didn’t actually talk. I’ve been having an issue with students not listening to other students talking, so I thought I’d take a cue from GWWG and Mr Healy and start the rule that you can’t talk unless you have the talking dog.