I’m sure this has never happened to you, my wonderful smart readers, but sometimes I read/hear something about math and outside I’m:
 But inside I’m really:
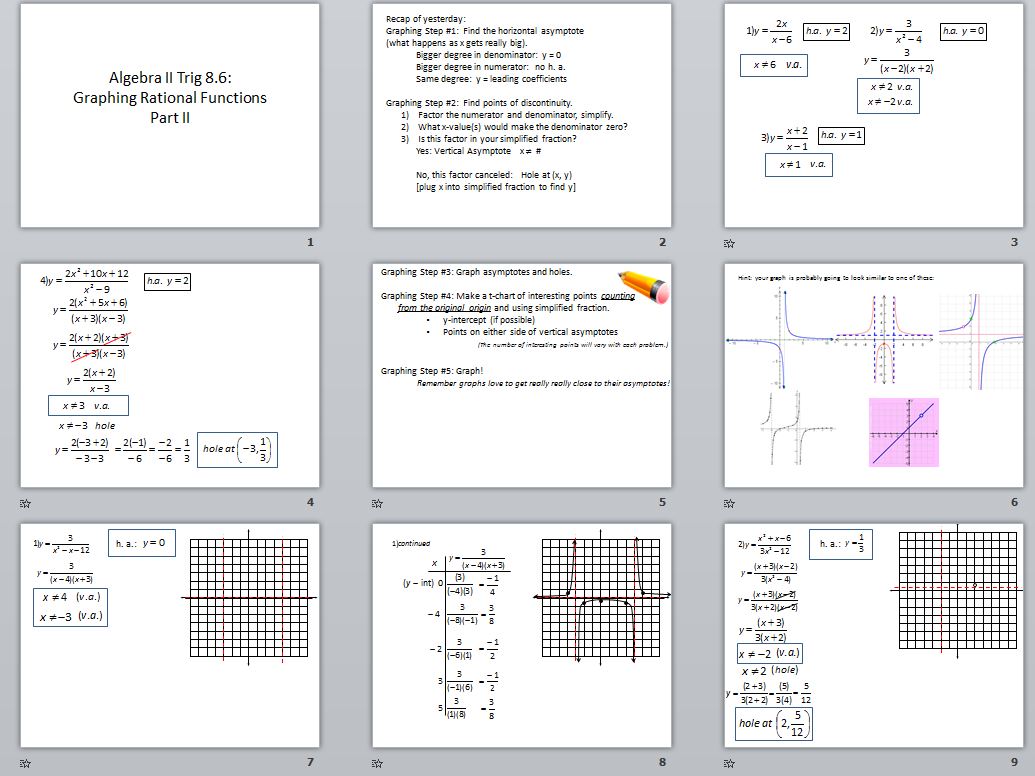

Case in point: Glenn’s (@gwaddellnvhs) obsession about how everything is just made up of lines (It’s somehow comforting to know that Dylan struggled with this idea as well.).
Well guess what, y’all? NOW I GET IT!
It was all thanks to a presentation by John Abby Khalilian that I attended at the Alabama CTM Fall Forum, where he not only presented an activity that involved multiplying lines, but actually had us do the activity. And I was fortunate enough to be seated next to another attendee (but I don’t remember his name!) who was super excited about joining me in a conversation about extending it past the Algebra I level at which it was intended.
I modified the original file slightly (with permission from Dr Khalilian):
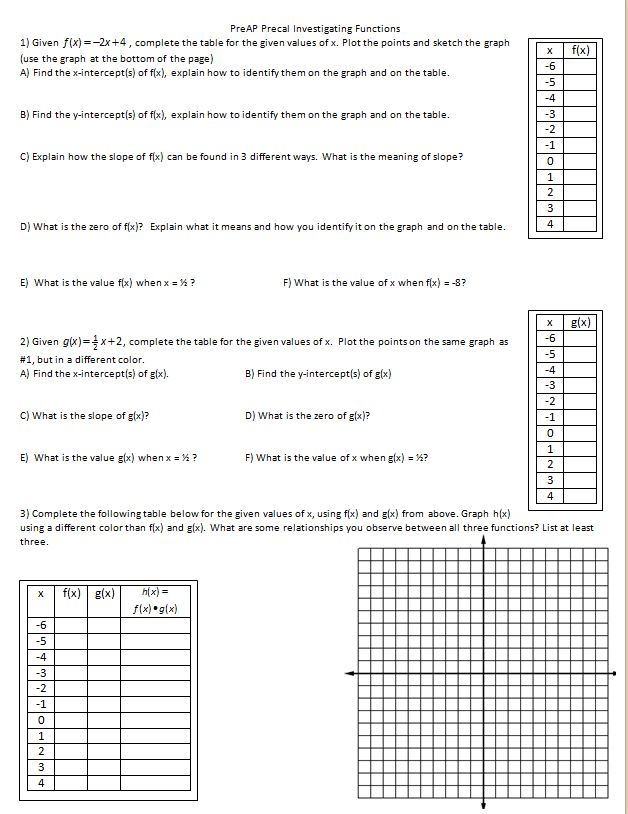
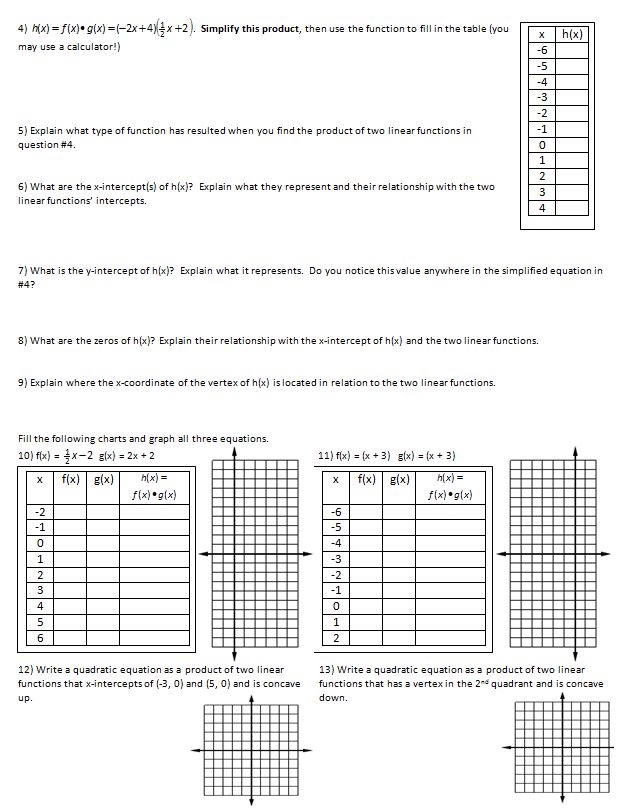 (File here) I urge you to work through the first page–I promise you this whole made-up-of-lines-thing will finally make sense! Note: I would make some modifications for next year. First, Dr Khalilian gave us two versions and I used the one we did in class. However, his first version used two positive-sloped lines, which I think would work better as the first example (Just use the lines from #10) Second, instead of giving them the equations of the lines in #10 and 11, I would have them already graphed and ask them to sketch the result?
Also, I know what you’re thinking, “Man, those are some Algebra I level questions on the first sheet.” I agree, and yet it was definitely a review that my Precal students needed.
After the worked on this, we then reviewed graphing polynomials, tying it together with the idea that we were just adding another line and what that would do. I was also made sure to focus on the fact that, “Oh, we have two negative lines and a positive, that would make it positive” because I knew what was upcoming:
Polynomial and Rational Inequalities.
Well, it went stunningly this year. All we had to talk about was the fact that sometimes drawing all those lines could be tedious and messy, when all we really care about are the places where a line is positive and negative. And if the line has a positive slope, it will be negative before its x-intercept and positive after. Like most math things, easier to see than to tell:

The red represents the sign of the red line, blue of the blue line, and black is the final result. So now sign charts are SUPER EASY. We don’t plug things in! Who wants to do that? MATH BABIES, that’s who. We are going to use our BRAINS instead:
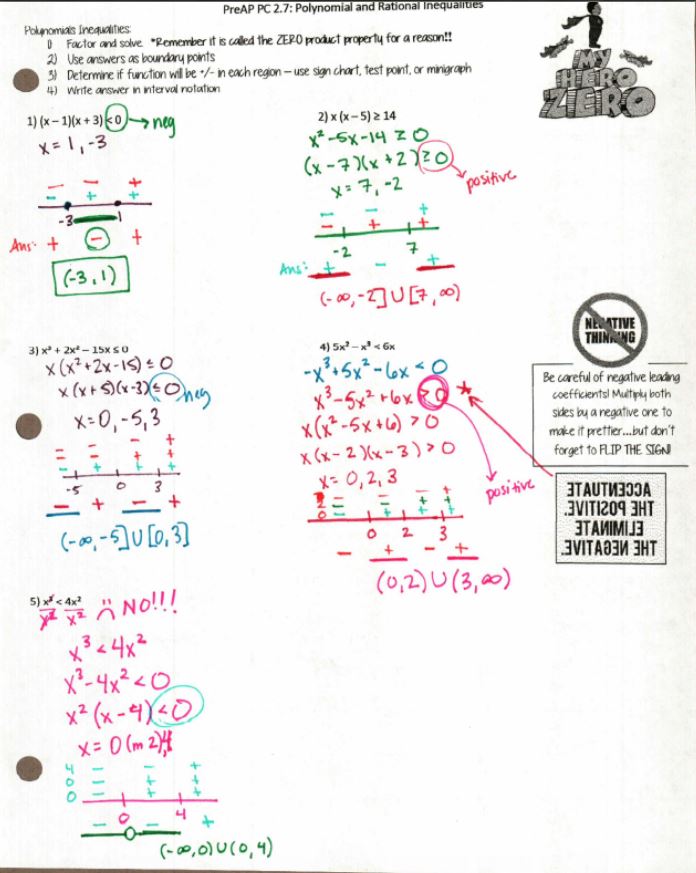
note the two rows needed for 0 in #5, since it is a double root, meaning there were TWO lines that had zero as an intercept
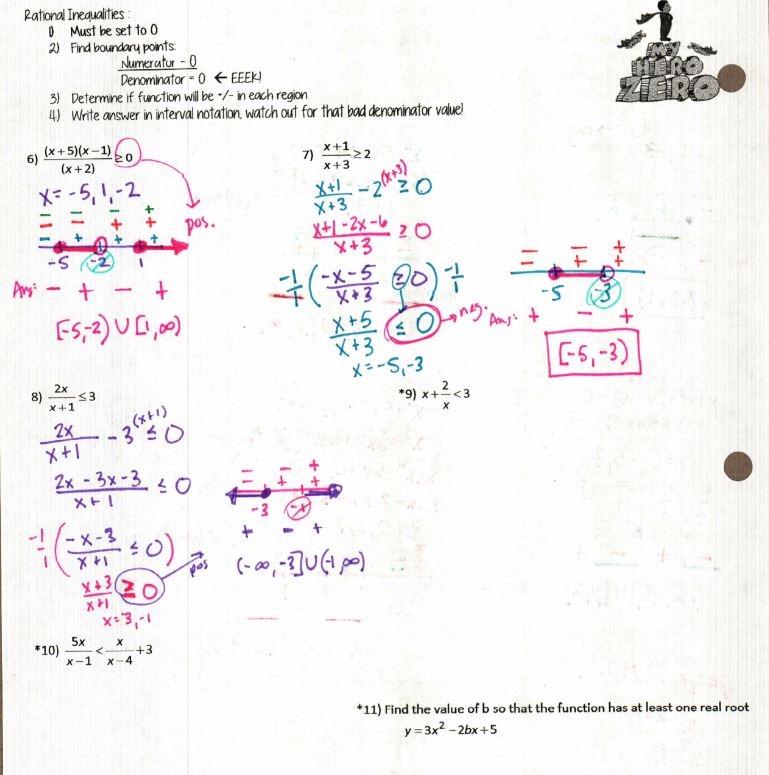
(file here) Note: I started them on the first page with making sure that we always got rid of a negative leading coefficient (you have to “flip the sign”–get it??). This made it easier on the back when we had -x-5 hanging around; yes we could have pictured a negative line and write the chart as + – – but I felt like they would forget that one was negative. Easier just to take care of it than remember it! They all did fantastic with this on their test!
I know, could this whole “everything is lines” thing get any more exciting and awesome? Yes. Hold on to your hats, I’m going to change your Rational Function Graphing World.
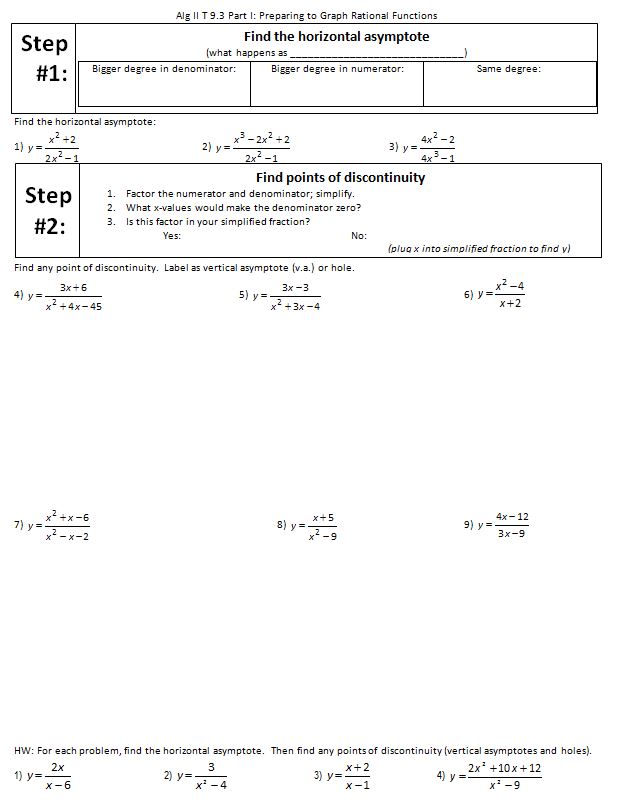
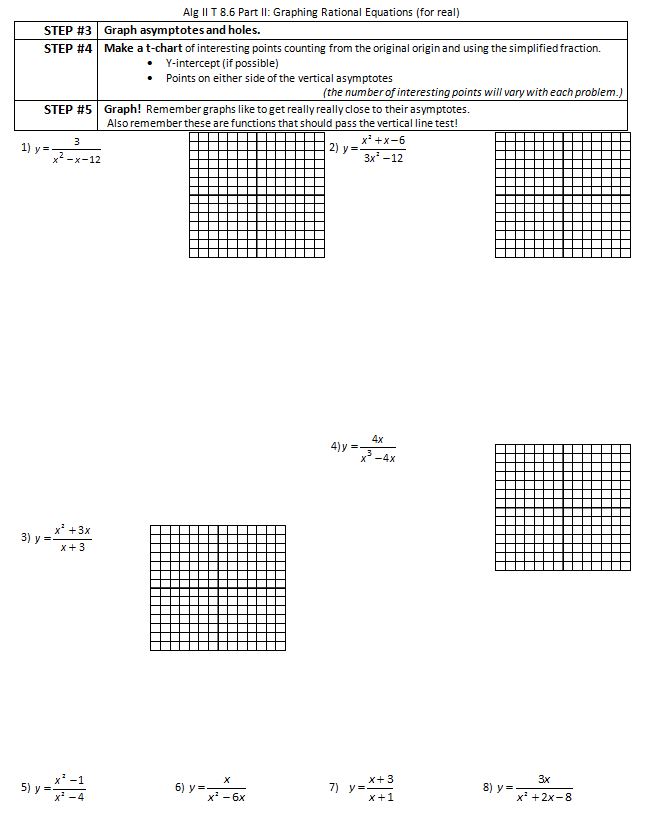
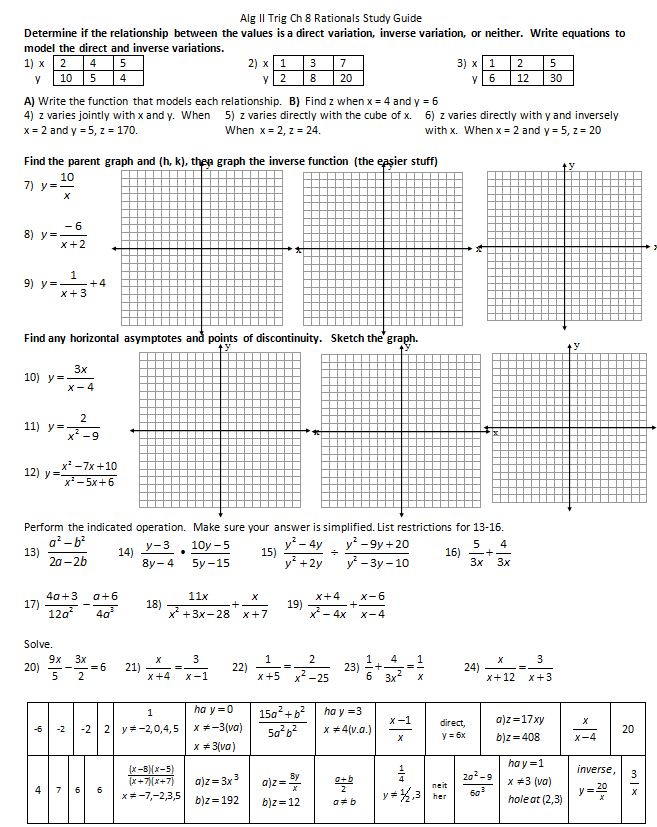
Maybe your world use to be like this: Find your horizontal and vertical asymptotes (and holes) using these rules that I told you. Then make a t-chart of all the values on either side of the vertical asymptotes and plug in to find points to graph:
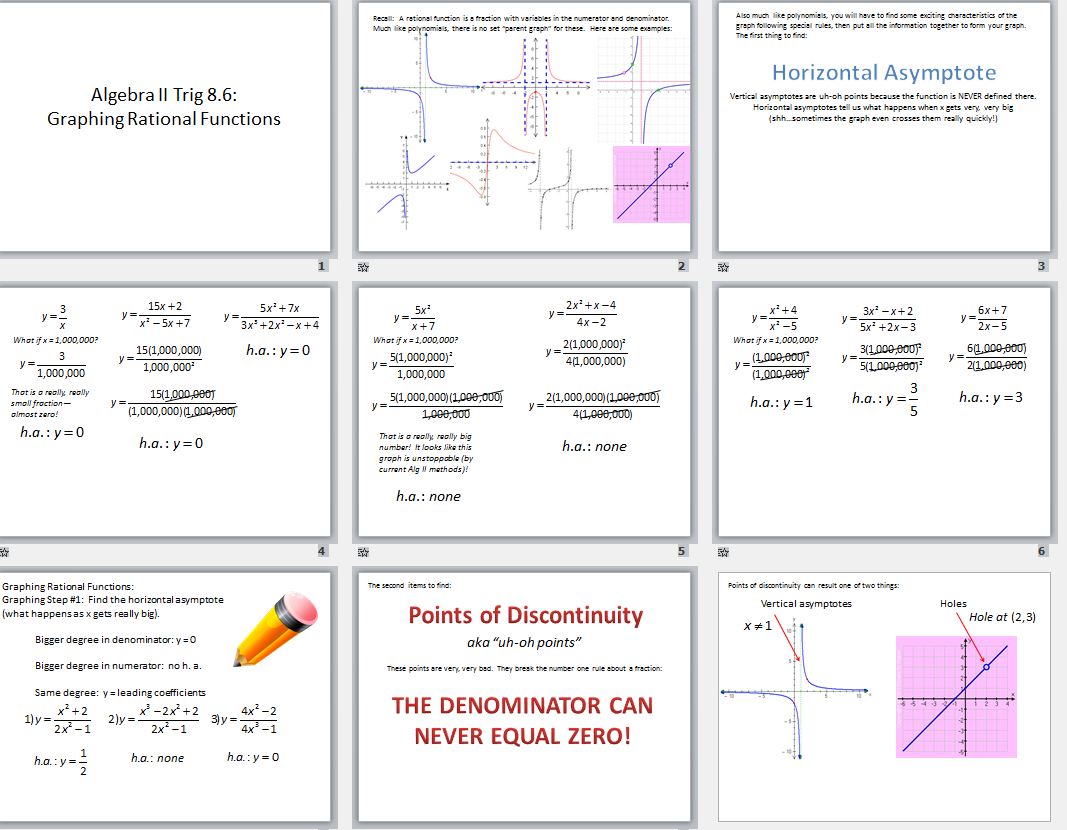
See, I hated doing the arithmetic so much I made it into a powerpoint. (But the powerpoint is pretty awesome for introducing horizontal asymptotes).
But then I used Kate’s wonderful introduction to rational functions worksheet that I always admired but never quite saw how it fit we how I graph rationals, but NOW I GET IT! It’s just like polynomials, except dividing! (modified only because I did not want to pay scribd to download it, plus one page, amirite?)

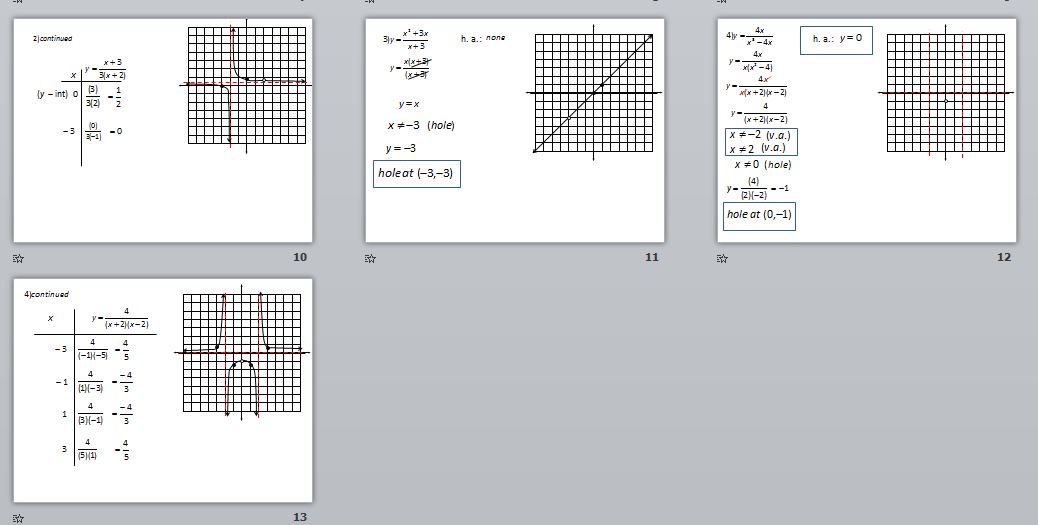
(File here) I’m going to modify some more for next year by (a) replacing trash panda (I have a serious problem where I can’t leave blank space) with the questions “what is the equation/zeros of f(x)/g(x)?” and (b) adding some more graphs, mostly stealing from being inspired by Sam’s worksheet. Instead we spent a few minutes the next day talking about what would happen if we were dividing a line by itself in order to lead into the idea of a hole.
So NOW! we can graph rationals THE SUPER EASY AWESOME WAY.
H: Find the horizontal aysmptote
F: Factor and find holes
Z: Find zeros of the numerator (x-intercepts) and denominator (vertical asymptotes)
S: Make a sign chart with all the zeros you found in the previous step and then graph!
When I asked the students to come up with a mnemonic, the most memorable was, “Horses Fart, Zebras Smell.”
So here it is in all its glory: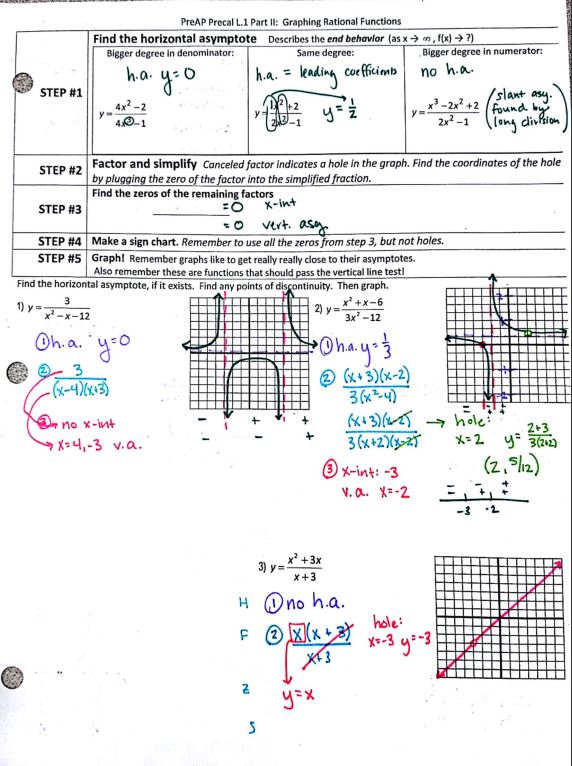
(file here, with more practice on page 2!) More modifications to make: Now that I don’t need all that space for a sign chart, I can add another example to the front! The one we did in class involved two factors in both the numerator and denominator. Also, I would change #2 so the horizontal asymptote isn’t 1/3! If you notice, in #1, I did the sign chart below the graph, but that got super confusing in #2 with everything so close together, so we started drawing it separately. We almost finished up the front page (including introducing horizontal asymptotes with the above-mentioned powerpoint) in one day, then did a couple more examples and practice on the back the following day. When we get back from spring break, we’ll do another day involving Weird Things That Can Happen like 1/x^2, but I think the sign chart is going to work nicely again!
I hope this helped you figure out the power of understanding the whole “everything is lines” idea and how it can carry through to so many things!