HUGE HUGE HUGE hat tip to @jreulbach and @MrsDavisAlg2 for introducing me to My Favorite. If you make any of your own worksheets, tests, or warmups and if those include graphs, this is going to be YOUR favorite favorite as well (I guess you could check out the other favorites from the ExploreMTBoS blogging initiative, but I’ll know that this one is secretly still your favorite)
Let me preface by saying that I love Desmos. I love introducing teachers and students to it for the first time. So intuitive and the graphs are so pretty…until you try to put them in Word. Then the graph is too big or the font is too small and you can’t label and the grid lines aren’t where you want them and you can’t see the gridlines when you copy on the copier and yes, there are some workarounds and hacks but at 8:30 the night before I’m giving a test I just want to painlessly insert a readable graph. I actually got pretty good at using wordart to graph stuff (please don’t even mention the horrible graphs that come out of the Microsoft Math add-on), but still, it was time-consuming and not perfect.
Enter: graphfree.com
(If I was one of those annoying websites with sound, I’d have a chorus of angels singing right now)
This is EXACTLY what I needed. 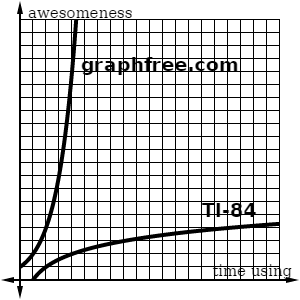
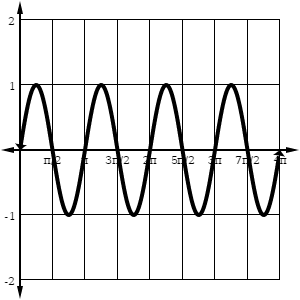
The above graph took me a minute, maybe two at the most. The program is fairly intuitive (there’s also a great user guide and videos), so I’m just going to point out some things you may not notice at first glance.
Hint: To make labels, under the calculator, there are three tabs. Choose “set custom note texts” and type your labels. Once you “Create Plot” you can drag the labels around the graph. Note: The location resets every time you “Create Plot” so wait until you have your final version of your graph before you drag them around.
Hint: (I just found this one out this week!) You can make a custom quickset with all of your settings. Look at the very bottom (below the three tabs below the calculator), you’ll see “apply custom quickset” and “create custom quickset.” I like -8 to 8 on my axes with black gridlines, so I set that as quickset. Now I just click that when I open the page and it’s magic!
Did you say you wanted to make some inequalities?
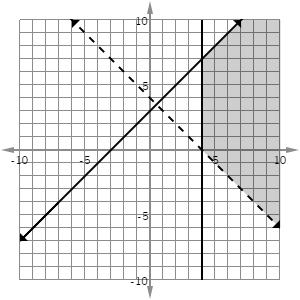
Hint: Again, below the calculator, there is a tab for “set shading options” Here you can tell it shade above/below any of your functions, and also shade right/left/above/below vertical or horizontal lines. Note: it does not graph the actual line for the right/left/above/below shading. I added the vertical line by choosing the “implicit” plot type and entering x = 4. Alternatively, there is an “asymptote” plot type that will give you a dashed line.
The asymptote is what I used for the axis of symmetry:
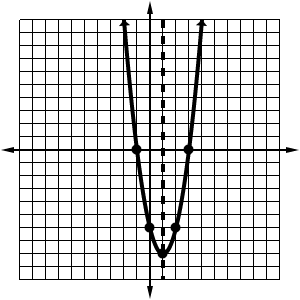 Hint: Use the scatterplot type to add specific points to the graph.
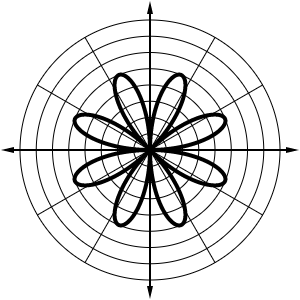
There’s also polar:
And Cartesian in radians in terms of pi! (this option is found under “Grid Type”)
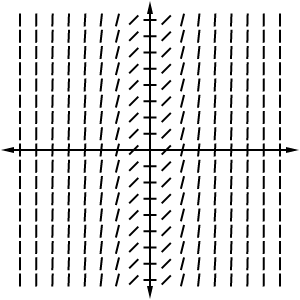
And slope fields for you Calculus folks (under “plot type”):
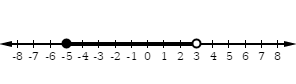
And even number lines! (Hint: make sure both the plot type and the grid type is set to Number Line)
The only thing that’s a little tricky is getting it into your Word document. You can either use the snipping tool OR right click, copy image, then in Word select “paste special” then “device independent bitmap”. I like to set the pixel image size to about 200 x 200; I usually don’t have to resize it once I paste it. For more details about how to insert the image, see the user guide here.
Seriously, spend 10 minutes reading the user guide and watching the videos and you will be a Graphfree expert.
Bonus hint: you can also not plot any function to make a blank coordinate grid for worksheets and tests!
I told you it was going to be your FAVORITE favorite!!!!