Some days this job can be a bit ho-hum. Teach a lesson you’ve taught 37 times before, grade a few tests, make some copies, go home. And then some days you get to learn math that you totally thought you knew, but you had no idea. Friday was one of those days. I’ve been teaching long enough that I probably should have known this stuff, but I didn’t. So here I am to enlighten you as well. Just be prepared for the following to occur:

Topic 1: Classification of Systems
Am I the only one that is really bad at reading directions? But then the students actually read it word for word and ask questions that I didn’t see coming because I knew what the question was really asking without having to closely read it. This week, we had a question about making an independent and inconsistent system, which I read as “inconsistent” and knew what the goal was, but then that pesky “independent” thing was brought up by students.
So I always thought there were three types of systems:
Independent: One Solution
Dependent: Infinite Solutions
Inconsistent: No Solutions
TURNS OUT I was mushing two different categories together:
Category One: Is there at least one solution?
Yes: Consistent No: Inconsistent
Category Two: Are they the same line? (Technically, “can one be formed from the other with algebraic manipulation?”)
Yes: Dependent No: Independent
So the correct categorization would be:
Independent and Consistent: One Solution
Dependent and Consistent: Infinite Solutions
Independent and Inconsistent: No Solutions
When you realize you’ve been teaching something wrong for your entire teaching career:

Topic 2: Logs grow really really slowly.
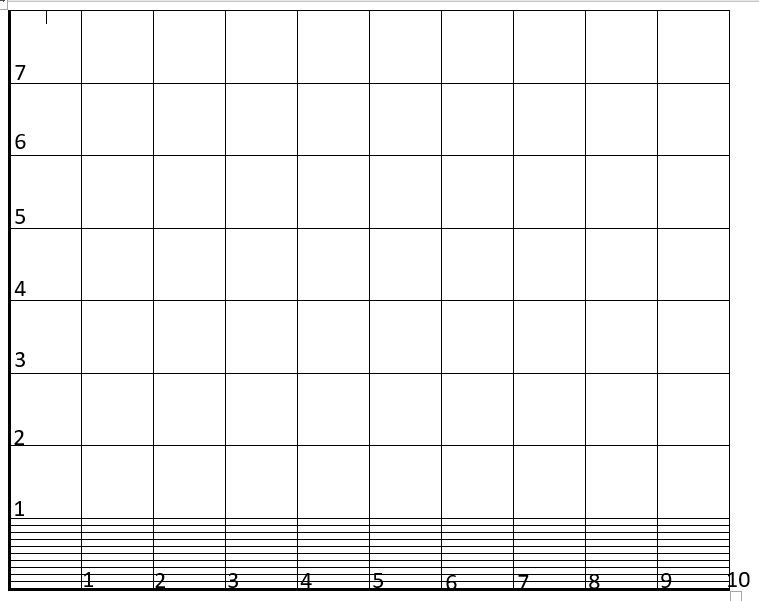
“Yes, Meg, we know that.” No, I don’t think you do. The wonderful MTBoS Search Engine led me to this GREAT activity from @Johnberray. I modified it a bit, first of all by making some pretty 1-inch graph paper:

(file here) Each group got a sheet in a dry erase pocket and used their calculator to find the decimal values to graph y = log x. Then I asked them to calculate how many inches it would take for it to function to reach 2, 4, 6, and 8 inches high. (At least one group each period said 20, 40, 60, 80 so we may not have the idea of logs down pat just yet). Then I asked them to describe each distance in some way–is it the size of a pencil? classroom? from here to the front office? as tall as basketball goal? I let them use the internet and a student showed me that if you put a measurement into Wolfram Alpha, it will give you real world comparisons! Pretty neat!
You really need to try it for yourself! What fun we had when we started talking about how long the paper would be for a height 6, 7, and 8 inches (oh, plus go ahead and try 9!) using this draw-a-circle-on-a-map site that John had linked to. Then it turned into, how high will it be if the paper reaches the moon? The sun? Pluto? I won’t give it away, but guys, logs grow really really really really really slowly.
Yet they still go to infinity.

One raised to any power is equal to one, oh, unless that power is infinity.
So I’m pretty good with limits. Then my Calculus teacher friend mentioned, hey, isn’t it weird that the limit of (1 + 1/r) ^ r is e, not 1? Wait, that doesn’t make sense. But it turns out 1^infinity is indeterminate. WHAT? But I thought 1 to any power is 1! WHAT IS HAPPENING TO EVERYTHING I THOUGHT I KNEW? The best answer I saw was that “we don’t know if the one is really a one”, which ok, I guess, since 1 + 1/r is never exactly one. But what if the number IS actually 1? Not like “kind sorta” close to one but ONE. If 1^infinity isn’t one, at what number does it STOP being equal to one?

I was discussing all this mind-blowing math with my friend right as class was starting, complete with dramatic re-enactments of how high the graph of log will be on Pluto and what was happening to my brain. When I came into class, a student asked what we were talking about and I said “Math!” and she said, “You really do like math a lot, don’t you?”
Yes, yes I do. 🙂

