This may not solve *all* of your current problems in life, but it may help with a few: that email you send every time a new student comes to class, the list of suggestions on how to improve your grade, wanting to leave the same comment on multiple students’ feedback, working in Google Docs or Forms and needing a math symbol, having a really long course title name that you always have to type out, being too lazy to type your entire name at the end of an email. The answer to all of these is:
Get a text expander!
I used to use one way back in Windows XP and I had a teacher say it was one of the most helpful things he ever installed. But then it didn’t work in Windows Vista and I sort of forgot about it because mostly I used MS Word and created my own shortcuts in there.
But then an article from Wired reminded me about them and I’ve been using one this week and, well, as I said, it’s magical.
I did about 3 minutes of research and went with Auto Text Expander. It seemed easy to use and was free. We’re a Google school so I do everything in Chrome now anyway. If you still do a lot of work in MS Office, you may want to research into one of the system-wide ones mentioned in the Wired article.
So anyway, what does it do?
Well, you set it up so you type a few letters and it expands it into your personalized phrase. Here are some examples it comes preloaded with:
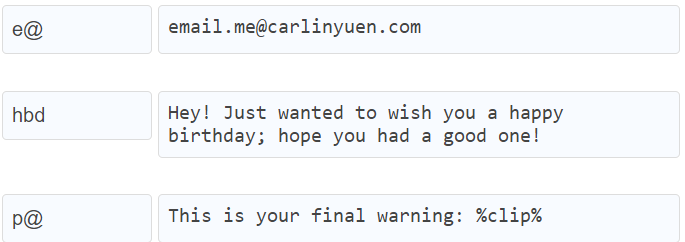
(The %clip% code inserts whatever is on your clipboard.)
But you can really put ANYTHING in the expansion section. For example, maybe you need to send emails about failing grades. So you could make “failtest” to expand to:
“Hello,
Your student currently has a <!-?atec?-> in my class. This is mainly due to low test scores. My tutoring zooms are Monday and Wednesday at 2:00 pm.
Please let me know if you have questions,
Meg Craig”
Then you could make “failassign” to be the same thing, but have the reason being that they have not completed assignments. The <!-?atec?-> puts the cursor in that spot so you can input the grade.
But “my class” is fairly generic, eh? Well, you could type the actual course in the subject line of the email use the text expansion algI to put “Algebra I with Probability” in the subject line of the email.
So now your workflow would be:
1. New Email
2. Paste parent email into to:
3. Subject line: type algi
4. Body: type failtest, type the grade, send.
WHOA, am I right??!?!
I also added “gm” for Good Morning! as an email salutation and “tmc” for Thanks, Meg Craig for my signature.
I see this also being handy to leave feedback on Google and Desmos. Make shortcuts for commonly used comments (wn: “watch your negatives!”) and/or make specific comment shortcuts for the actual assignment. Like if everyone thought cosine was 0 at π, you could have “c0” expand to “Remember cosine is the x-coordinate! Where is π radians on the x-axis?”
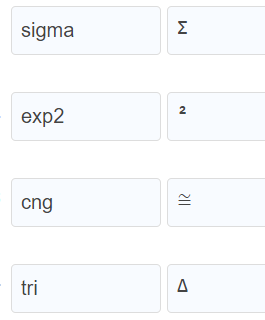
Oh, ahem, did you also see what I did there with the actual π symbol? Yes, you can also use symbols in your shortcuts, and make shortcuts for just symbols. This could be life changing for all you Geometry teachers out there! Think trg = Δ, cng = ≅, exp2 = 2, theta = θ, sigma = Σ. I simply google “blah blah blah symbol” and copy and paste the symbol into the text expansion.
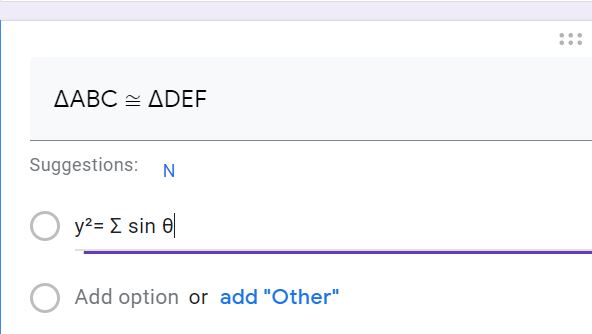
Did I mention this also works in Google forms?
(Ironically, it does not work in WordPress editing. So after you install it, you may want to check to see if it works in your programs before you spend too much time making phrases.)
With a little bit of time spent setting it up (psst…to edit the phrases, click the puzzle piece in the top right of your chrome address bar and select the expansion), I think you’ll find it will pay off in the long run! I’ll leave you with three hints:
- Make sure your code phrase isn’t something you’ll commonly type. For example, I used “es” for Environmental Science, which was great until I typed “these” and Environmental Science ended up in the middle. Changing it to evs solved the problem! That’s also why I used trg instead of tri for Δ (I mean, yes, you could also use delta but I was using it as a triangle in this context. Plus think of the delta math issue!)
- Make a little cheat sheet post-it for your computer monitor of your codes until you have them memorized.
- If you’re using Auto Text Expander, click export and copy it in an email to yourself in case you lose your backup!
I hope you give this a try and I really hope it adds a little well-deserved magic into your life!! Pretty soon you’ll be telling yourself: